The demographics of declining college enrollment

Education_College Student

Despite a rise in high school graduation rates, college enrollment is dropping from its 2011 peak, leaving many small colleges scrambling.  Here in Virginia, enrollment has largely been steady, but two small colleges closed in the last two years, and others have sounded the alarm on declining enrollment or missed targeted growth.  Every struggling college certainly has its own history and unique problems.  But larger trends always pick off stragglers.  In Warren Buffet’s words, “when the tide goes out, you find out who’s been swimming naked.”  And the tide appears to be going out.  A rash of articles has addressed the subject, with some of the leading culprits being the improved economy and job prospects for those without degrees.

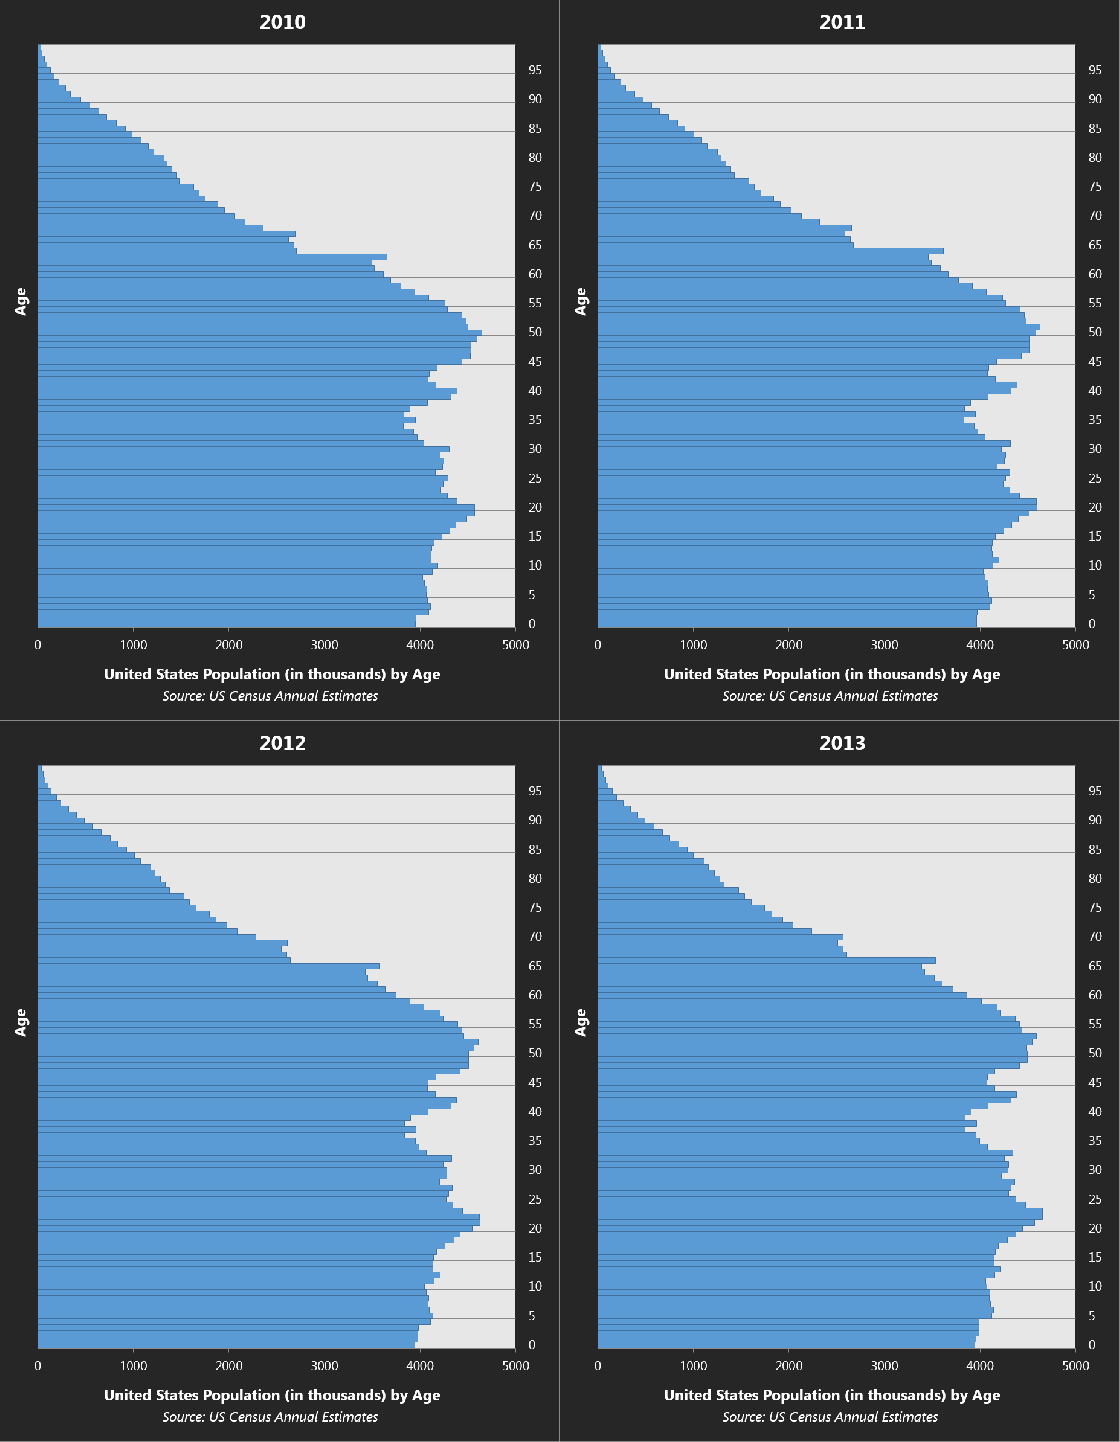
But the big factor that doesn’t seem to be well-understood is simple population math.  College attendance has climbed over the years to the point where an overwhelming majority of American young people will enroll in college of some kind at some point.  This makes college enrollment extremely sensitive to fluctuations in the number of young people available.  The generation currently in college or recently out of it is one of the largest this country has managed to produce.  It’s no wonder there was a spike in enrollment, recession or no, back in 2008-09 if one looks at the number of Americans who were just reaching 18-19 years of age.  Since then those numbers have fallen sharply and will continue to fall more slowly for the foreseeable future as the U.S. birth rate hovers below replacement (on a positive note, most of that decline is attributable to a precipitous decline in teen pregnancy).

Here is the United States’ population by age from 2010-2013.

All

Continue reading

Ancestry: Who do you think you are?

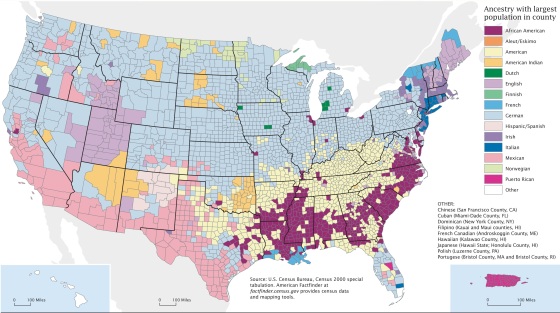
Largest Ancestry: 2000

Census-2000-Data-Top-US-Ancestries-by-County 2

This is one of my favorite demographic maps. It was produced by the Census Bureau to show the most commonly reported ancestry for each county in the United States in 2000. Even though the data is over 13 years old, the map remains very popular.

Since a follow-up map for 2010 has not been produced yet, I thought it would be more than worthwhile to create this map using Census American Community Survey data.

Largest Ancestry: 2010

Including Unreported

The methodologies used in making the 2000 and 2010 ancestry maps are similar, but there is one important alteration in the 2010 map. Ancestries that can be logically grouped together were combined so they might be better represented on the map. For example, Scandinavian ancestries: Norwegian, Danish, Swedish and Finnish, are very common in the Upper Midwest. Individually, they are the most popular ancestries in only a few counties, but when grouped together, Scandinavian is the most common ancestry in over 70 Upper Midwest counties.

Continue reading

Majority Minority by 2040?

Following the November election, much of the coverage focused on both the current and future impact of changing demographics. Changes in household structure and family formation, population aging, and increases in diversity are population trends that will continue to play out over the coming decades. Virginia’s demographic landscape, like the nation’s, is projected to shift substantially by 2040. Continue reading

Racial Segregation in Virginia’s Schools

Last week, May 17 to be exact, marked the anniversary of the Brown v. Board of Education decision, the 1954 Supreme Court case that declared racially segregated schools “inherently unequal.” Reading an op-ed this weekend that relayed some of the benefits of racially integrated schools piqued my curiosity about the status of school segregation in Virginia.

So I looked at the data, specifically, the fall membership data available from the Virginia Department of Education, including data on the number of black students, number of white students, number of economically disadvantaged students, and number of total students in each school in the 2011-2012 school year. From these, I produced a dissimilarity index – the segregation measure I discussed in a previous post – assessing how segregated black and white students were across the elementary schools in a school division (essentially, within a locality).

In my report on Blacks in Virginia, I noted that racially segregated neighborhoods produce more racially segregated schools. The graph illustrating the relationship is below:

Continue reading

Residential segregation in Virginia’s counties and cities

The Weldon Cooper Center released a report today examining geographic and demographic changes in Virginia’s black population over time: Blacks in Virginia: Demographic Trends in Historical Context. One topic in the report is the continued residential segregation of blacks in Virginia’s big metropolitan centers. I thought it would be interesting, as well, to have a look at segregation in all of Virginia’s localities.

First, some background. Residential segregation is most commonly measured with something called the index of dissimilarity. Here, we’ll measure how evenly blacks and whites are distributed across the census tracts within each county or city, based on the 2010 Census. The dissimilarity value can be anything from 0, complete integration (the proportion of blacks and whites in each census tract equals the proportion of blacks and whites in the county overall) , to 100, complete segregation (all of the blacks live in census tracts with no whites and all of the whites live in census tracts with no blacks).

Continue reading

Racial attitudes, the generation gap, and the political perfect storm

Over the past few weeks I’ve been watching closely the recent efforts by the National Journal to prominently showcase stories, polls, and news events that highlight demography and population change. With a particular focus on politics, the “Next America” project, beginning with the articles written by Editorial Director Ronald Brownstein, is an “unprecedented effort to explore the significant political, economic and social impact of profound racial and cultural changes.” I was grabbed by some of the findings from their latest article “Diversity Now.”

It is no surprise to anyone that the nation’s population is changing in a fundamental way. As a whole, the population is growing older, and this change is overlaying deep and enduring racial and ethnic divides in this country. The young are racially and ethnically diverse; the old are predominately white. In a few decades the U.S. Census Bureau projects that the United States will become “majority-minority.”  These fundamental changes will bring tremendous political challenges, as they have already begun to do. Perhaps not since the 1960s, when the boomers first entered the political scene en masse, will this country experience such generational conflict. Think of current political struggles over the national debt, old-age entitlement spending, or immigration and then imagine what the political debate around these issues will look like in a decade or two when more of today’s young people enter the political arena. The 2008 presidential race between Obama and McCain somewhat reflected this racial and generational gap. Obama, America’s first President of black descent, won with a minority of white voters while earning more than 80 percent of the support of non-whites; a strong majority of young people while declining support with older ages.

Continue reading