A funny thing is happening in many US cities

An article at the Urbanophile gives us a helpful graphic explaining the old and new “Donut” conceptions of the city.  In the “Old Donut,” we have an impoverished central city with a ring of thriving suburbs around it.

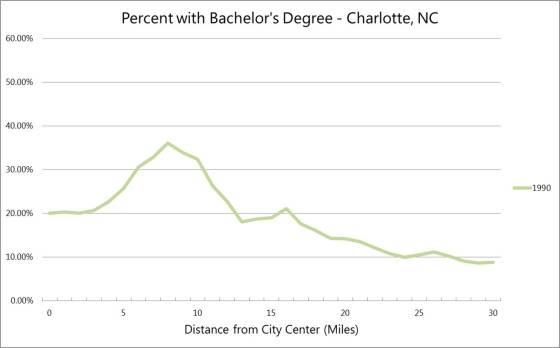
OldDonutAn example of that model appears in this graph, which shows the percentage of adults over 25 with college degrees in the Charlotte, NC metro area in 1990.  The x-axis is distance from the center of downtown.
charlotte1990

Continue reading

“Seeing” Virginia’s Workforce

FlowingData_ScreenShot_Virginia_MedIncWhen it comes to interactive data visualizations, I am a junky. I don’t mean the dime-a-dozen country maps showing the favorite baby name/band/movie/current fad for each state. I mean the kind that present information in a way that surprises me, even when I am relatively familiar with the data.

The Demographics Research Group has created some really illuminating data visualizations highlighting residential segregation by race, educational division in Washington, D.C., and this older one on electoral changes in Virginia.

Today I spent quite a bit of time exploring this interactive chart of Jobs by State and Salary, created by Dr. Nathan Yau over at FlowingData. In this chart, Yau shows the number of people employed and the median income for all jobs in a state. The top image shows the occupations in Virginia with a median annual salary of roughly $33,000 or more highlighted in green.

Continue reading

The Line that Divides DC

No it’s not a party line.  It’s an almost perfectly straight line running north-south along 16th Street, passing through the White House, and then continuing along the Potomac River to the south.  It divides two very different sides of the DC area.

These graphs are a cross-section of the DC area that looks at how the city changes as you travel from the center to the periphery.  I’ve split the graphs into two sides based on the east-west dividing line.  You’ll notice the first one or two miles to the east are much like their western counterparts (this is essentially the area around Capitol Hill and the National Mall).  After that, the two sides diverge pretty dramatically.DCEW Continue reading

The long distance runner: Lonely, no more?

Recently, Hamilton shared a great post about American ancestry. The first sentence of his post– “This is one of my favorite demographic maps.”— made me wonder: Have I ever said those words? Do I have a favorite demographic map?

There are plenty of maps that I appreciate for what they reveal, such as one from this past summer painting a stark picture of US income mobility. Some maps are more for fun: though I wish I had a better handle on the source, I definitely got a kick out of the map revealing the concentration of red-heads in Europe that made the rounds last year. And, of course, the Racial Dot Map was pretty great for both substance and style (though I personally think that the Congressional Dot Map was even more interesting).

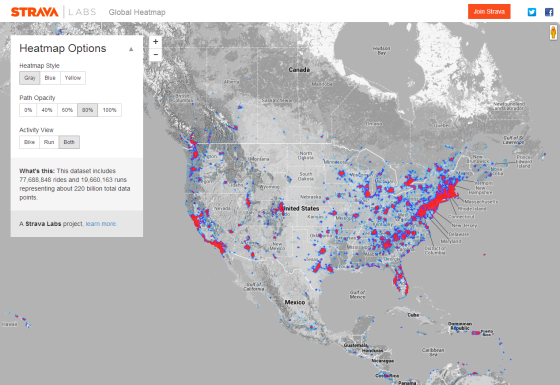
This week, though, I happened across a great new map that I appreciate not only for its visual appeal and powerful presentation of data, but also because it provides great information on a topic I care a lot about: running.

US

Continue reading

Official Poverty Estimates, in the US and the Commonwealth

This past weekend, The New York Times published an interactive map visualizing recently released Census data on poverty in America.  The NYT map gives information down to the census tract level; this level of precision allows the viewer to see poverty rates of not just counties and cities but, in fact, neighborhoods.

As for Virginia, poverty rates in Southwest, Southside and Hampton Roads far exceed the poverty rates of localities closer to DC.  According to these small area estimates, Falls Church County has the lowest poverty rate of around 3 percent, while Radford City and Harrisonburg City have the highest rates (34.2 and 37.5 percent, respectively).

Continue reading

A map that shows what’s wrong with Washington

2008 Election Dot Map, NortheastThe recent government shutdown and flirtation with default has seriously deteriorated public trust in Congress, and in Washington more generally.  Disgust with Washington is often followed by bewilderment. How did things get this way?

While there is no single answer to this question, if I had to choose one, it would be current redistricting practices. There is a strong case to be made that political polarization (and associated intransigence and brinkmanship) are rooted in gerrymandered congressional districts.

Gerrymandering, the art and science of lawmakers choosing their own voters rather than the other way around, has ensured that most representatives in the U.S. House are safe from general election challenges.  Without those challenges, positions taken by elected officials are not exposed to debate and to the typically moderating effect of contested elections.  In contrast, in gerrymandered districts where it is clear that one party or the other has a more or less certain general election victory in hand, candidates from the opposing party opt out of running (or have little real chance of winning if they do). As a result, the only threats to these lawmakers come in contentious primary contests from the hard left and hard right.  Being “primaried” is now a common term among political strategists, and is often used to describe well-financed tea party challengers who unseat moderate Republicans. As moderation, from either side, is lost in primary challenges, the result is more rigidly ideological victors and the deadlock we see with increasing frequency in Congress.

This connection between redistricting, polarization, and legislative dysfunction is complicated, and as soon as political scientists start talking about the nuances of this subject the message sometimes gets lost.  So I decided to create a visual to help illuminate what is really going on…

Link to the full interactive Congressional Dot Map.

Continue reading

Little Green Boxes

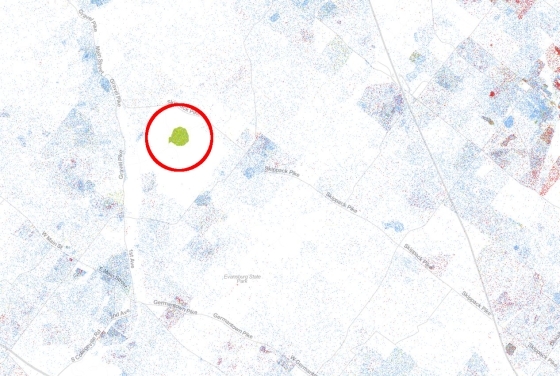
One of the most frequent observations from people who have recently viewed our new Racial Dot Map is the presence of these “little green boxes” scattered throughout the country.  The map displays a single dot for every person counted during the 2010 Census and every dot on the map is color-coded by race and ethnicity:  non-Hispanic whites = blue; African-Americans = green; Asians = red; Hispanics = orange; and all other races = brown.  These peculiar green boxes on the map can be found everywhere and seem oddly out of place:

In a suburb of Philadelphia:

Philly

Continue reading

The New Racial Dot Map

As our regular readers already know, I’ve been playing around with a lot of dot density maps lately.  Today, however, we are releasing something new I think you might enjoy even more.

We decided to rehash Brandon Martin-Anderson’s idea of plotting one dot for every person in the United States, but with an added twist.  The new Racial Dot Map is an American snapshot; it provides an accessible visualization of geographic distribution, population density, and racial diversity of the American people in every neighborhood in the entire country. The map displays 308,745,538 dots, one for each person residing in the United States at the location they were counted during the 2010 Census. Each dot is color-coded by the individual’s race and ethnicity.

RacialDotMap

The map is fully interactive so you can zoom into any neighborhood you wish.  You can read more about the map and how we created it here.

Enjoy!

Dustin Cable is a Senior Research Associate at the University of Virginia’s Weldon Cooper Center for Public Service where he conducts research on topics that lie at the intersection of demographics, politics, and public policy.