High Cotton: When Virginia’s Counties Hit Their Peak

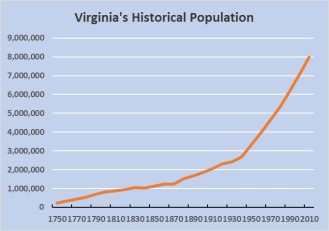
If you grew up in one of Northern Virginia's Historical PopulationVirginia’s suburban counties, such as Prince William, or in any of Virginia’s metro areas, you likely grew up with the impression that growth is as certain as the seasons. For decades, many counties in Virginia have grown relentlessly, constructing thousands of homes each year to house new residents. With more residents come more schools, roads, offices and shops. Except for the hard times around the Civil War, Virginia’s population as a whole has grown continuously since it was a colony.

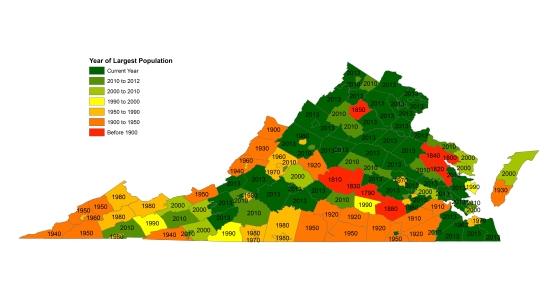
But outside Virginia’s largest urban areas, population growth is not a fact of life. In 2013, the population of most of Virginia’s counties and cities had declined from when it peaked in the past.Peak Population3

Continue reading

Virginia is getting older

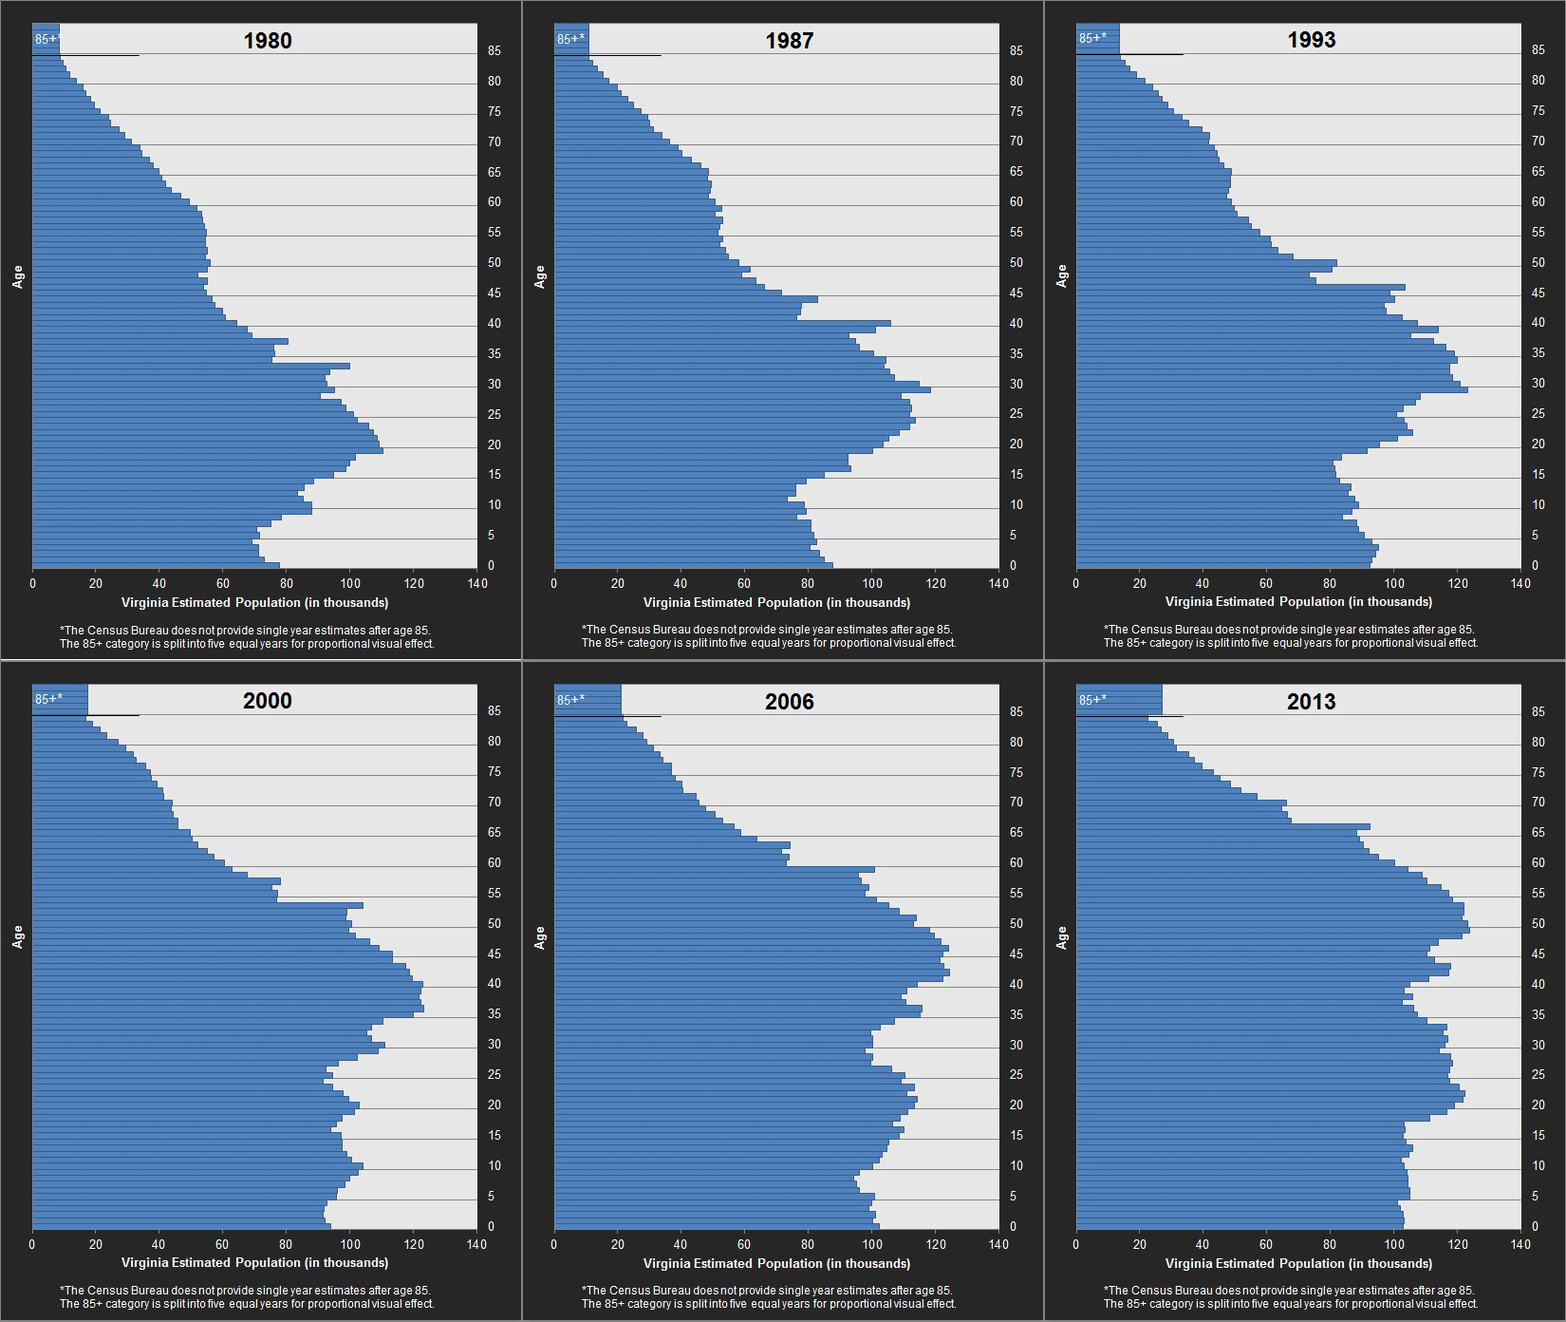
Like many people, I’ve been inclined to explain Virginia’s decades of explosive population growth in terms of migration and the Federal government’s expansion in Northern Virginia.  While that’s certainly part of the equation, “natural increase” has actually driven most of the growth, just as it has across the country.  Natural increase simply means more people are born than die in a year.  Even in Northern Virginia and Hampton Roads, natural increase is the largest generator of population growth.  But “natural increase” does not mean that we are having lots and lots of babies.  In fact, it has much more to do with the fact that we had a lot of babies a while back and since then people started living a lot longer.

You hear, on this blog and elsewhere, about the “aging population,” but I wanted to show exactly what that means.  Here’s the one gif you need to see to understand population growth in Virginia:

1980

Continue reading

Virginia’s Regions: Northern Virginia is Different

This week, the Demographics Research Group updated its profile of Virginia’s regions. The eight regions of the Commonwealth were identified by the Demographics Research Group based on proximity, geography, demographic characteristics and shared socioeconomic conditions. While there are many shared characteristics across Virginia’s regions, our profile shows that a number of differences exist as well.

2

Northern Virginia stands out the most among Virginia’s regions, but this is not a new trend as Charles Grymes notes on Virginia Places:

“Northern Virginia has been “different” ever since Lord Fairfax established a land office issuing Northern Neck deeds independently from the colonial government in Williamsburg” Continue reading

What’s Driving the Rise in High School Graduation Rates?

Much of the news that circulates regarding the state of education is not positive, but one trend that remains underreported is the significant rise in public high school graduation rates during the past decade. By the end of this month, around 85,000 high school seniors are expected to have graduated from Virginia’s public schools.That is nearly 8,000 more than would have been expected to graduate just a few years ago.
Virginia High School Graduation Rate Continue reading

Home Construction: Running to Stand Still

New home construction rose over 23 percent in Virginia between 2012 and 2013, according to building permit data collected by the Census Bureau and the Weldon Cooper Center. In suburban counties, the number of new homes built during the past year increased much more than in urban localities, but construction levels still remain a fraction of those seen during the early 2000s housing boom.

 Homes Built Annually in the Mid Atlantic

This slideshow requires JavaScript.

Click on arrows at bottom of slideshow to scroll through years

Continue reading

Education in Virginia: Doing it at home

Father helping his son with homework

Three decades ago homeschooling in Virginia was legally questionable and rare. But since the Code of Virginia was amended in 1984 to specifically allow for homeschooling, the number of children educated at home has grown steadily. When the Virginia Department of Education first began counting the number of homeschool students in 1989, there were 3,000 students. In 2012, there were 33,000, making up more than a quarter of all children not enrolled in public school in Virginia.  Continue reading

As more families choose cities, governments are returning to the drawing board

Urban areas import the young and export the old, the theory goes, or went. For decades, young people have come to Virginia’s urban areas to go to university or work, often moving out again when their children require more space or education, or when they retire. But, since the mid 2000s, a demographic change has slowed the conveyor belt of movement in and out of cities. More young families are staying in Virginia’s urban areas to raise their children and enroll them in local schools, fueling the strongest population growth many of Virginia’s urban areas have experienced since the 1950s.

Though many young couples in the past have started families while they lived in urban areas, a good number would move to suburban counties before enrolling their children in school. In urban school divisions such as Arlington County and Fredericksburg, fewer than 60 percent of children born in 1999 showed up in first grade in 2005. The large number of young families moving into suburban school divisions caused many more children to enroll in first grade in counties such as Spotsylvania and Chesterfield than were born there six years earlier.2005 Ratio

Source: Virginia Department of Education Fall Count, Virginia Department of Health Live Births, tabulated by the Weldon Cooper Center

Today, many parents are staying put in urban areas, thanks to stricter mortgage regulations that make it hard for buyers to get a loan, and a difficult labor market that makes it hard for anyone to be sure of a job. One-third as many homes were sold in 2012 as in 2005 in Virginia. During the same period, the Census Bureau’s American Community Survey shows that the number of Virginia families with children who live in a rented  residence has increased 15 percent.

Continue reading

Ancestry: Who do you think you are?

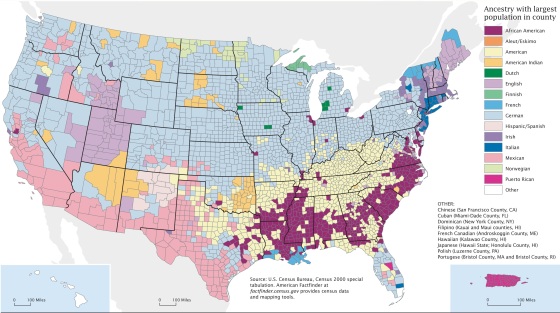
Largest Ancestry: 2000

Census-2000-Data-Top-US-Ancestries-by-County 2

This is one of my favorite demographic maps. It was produced by the Census Bureau to show the most commonly reported ancestry for each county in the United States in 2000. Even though the data is over 13 years old, the map remains very popular.

Since a follow-up map for 2010 has not been produced yet, I thought it would be more than worthwhile to create this map using Census American Community Survey data.

Largest Ancestry: 2010

Including Unreported

The methodologies used in making the 2000 and 2010 ancestry maps are similar, but there is one important alteration in the 2010 map. Ancestries that can be logically grouped together were combined so they might be better represented on the map. For example, Scandinavian ancestries: Norwegian, Danish, Swedish and Finnish, are very common in the Upper Midwest. Individually, they are the most popular ancestries in only a few counties, but when grouped together, Scandinavian is the most common ancestry in over 70 Upper Midwest counties.

Continue reading