The demographics of declining college enrollment

Education_College Student

Despite a rise in high school graduation rates, college enrollment is dropping from its 2011 peak, leaving many small colleges scrambling.  Here in Virginia, enrollment has largely been steady, but two small colleges closed in the last two years, and others have sounded the alarm on declining enrollment or missed targeted growth.  Every struggling college certainly has its own history and unique problems.  But larger trends always pick off stragglers.  In Warren Buffet’s words, “when the tide goes out, you find out who’s been swimming naked.”  And the tide appears to be going out.  A rash of articles has addressed the subject, with some of the leading culprits being the improved economy and job prospects for those without degrees.

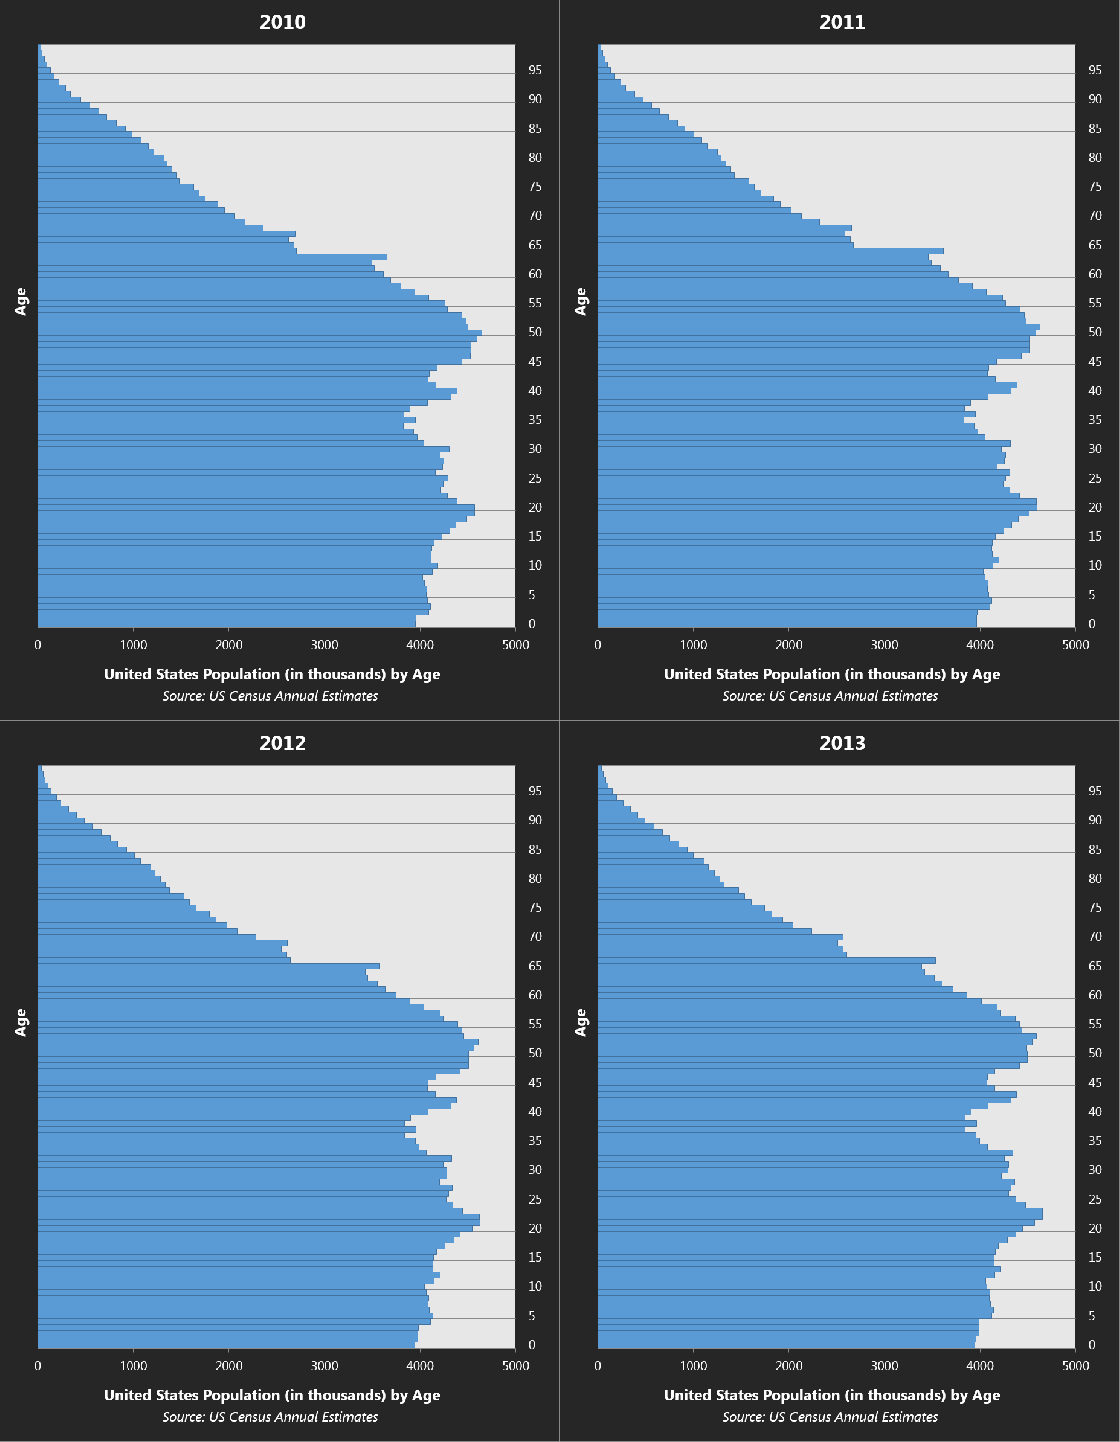
But the big factor that doesn’t seem to be well-understood is simple population math.  College attendance has climbed over the years to the point where an overwhelming majority of American young people will enroll in college of some kind at some point.  This makes college enrollment extremely sensitive to fluctuations in the number of young people available.  The generation currently in college or recently out of it is one of the largest this country has managed to produce.  It’s no wonder there was a spike in enrollment, recession or no, back in 2008-09 if one looks at the number of Americans who were just reaching 18-19 years of age.  Since then those numbers have fallen sharply and will continue to fall more slowly for the foreseeable future as the U.S. birth rate hovers below replacement (on a positive note, most of that decline is attributable to a precipitous decline in teen pregnancy).

Here is the United States’ population by age from 2010-2013.

All

Continue reading

A funny thing is happening in many US cities

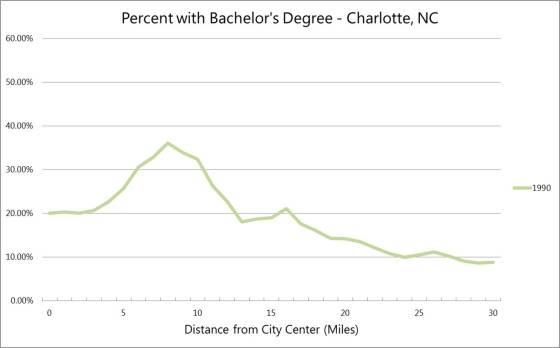
An article at the Urbanophile gives us a helpful graphic explaining the old and new “Donut” conceptions of the city.  In the “Old Donut,” we have an impoverished central city with a ring of thriving suburbs around it.

OldDonutAn example of that model appears in this graph, which shows the percentage of adults over 25 with college degrees in the Charlotte, NC metro area in 1990.  The x-axis is distance from the center of downtown.
charlotte1990

Continue reading

High Cotton: When Virginia’s Counties Hit Their Peak

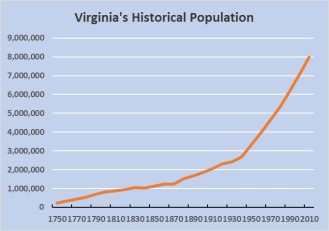
If you grew up in one of Northern Virginia's Historical PopulationVirginia’s suburban counties, such as Prince William, or in any of Virginia’s metro areas, you likely grew up with the impression that growth is as certain as the seasons. For decades, many counties in Virginia have grown relentlessly, constructing thousands of homes each year to house new residents. With more residents come more schools, roads, offices and shops. Except for the hard times around the Civil War, Virginia’s population as a whole has grown continuously since it was a colony.
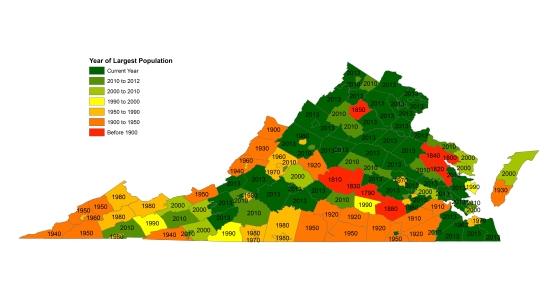
But outside Virginia’s largest urban areas, population growth is not a fact of life. In 2013, the population of most of Virginia’s counties and cities had declined from when it peaked in the past.Peak Population3

Continue reading

Retiring Boomers are going rural (but not too rural)

There is a lot of buzz amongst urbanists and demographers about millennials’ preference for urban areas.  We’ve found evidence to support this narrative in some areas of Virginia, including indications that they may be staying even after having kids.

But there’s also a lot of talk about baby boomers retiring and moving into cities.  Maybe this is happening in other parts of the U.S., but it’s certainly not the case in Virginia.  On the contrary, they appear to be heading for the hills.  In fact, despite Forbes Magazine naming Virginia its 5th best state to retire in, Virginia does not appear to attract many retirees in general.

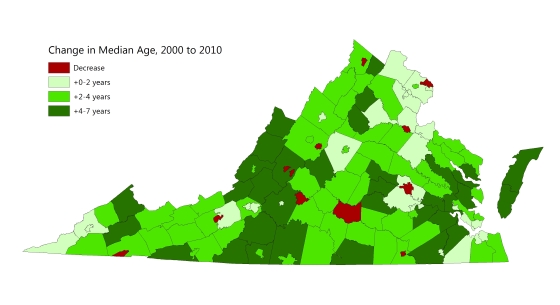
Virginia is aging quickly, as can be seen on the map below.  From 2000 to 2010, the median age in the Commonwealth rose from 35.7 to 37.5.  In some localities, it rose by as many as 5 or 6 years in just that 10-year period.  But most of that is due to a gradual decline in birthrates, not older people moving in.  From 2000 to 2010, migration accounted for only a slight (1-2%) increase in the population of age groups around retirement age, and that increase was smaller than the state’s overall growth rate.

Median Age Change

Continue reading

How do we know whether development pays for itself?

Local governments across the country have come under increasing fiscal strain in recent years, with several being forced to declare bankruptcy.  The problems range from pension programs and decaying infrastructure to falling revenues from industrial and sales taxes as manufacturing gets offshored and shopping happens online.  In Virginia, cities are further constrained by annexation laws that prevent them from expanding with their metropolitan area and gaining revenue from greenfield development or wealthier suburbs.

Meanwhile, the high mobility of Americans and increasing specialization of metro areas and cities have forced localities to behave like competitors in a market for residents and businesses, rather than as simple political entities administering a group of people.  This makes it more important than ever for localities to understand which investments and spatial configurations create value and which don’t.  The immediate problem is that we lack good ways of approaching the question.

Property value per acre is a good start on the revenue side.  Not only is it influenced by different types of public investments that people want to be near, it’s also heavily influenced by local land use law – namely, how many people are allowed to live on a piece of land.  The assessed value, which is mapped here, determines how much revenue the locality generates via property tax.  That’s important because many of the costs cities have to bear are determined primarily by the amount of land they have to cover (see chart below).  That means that if land is not generating enough tax value per acre, some municipal services will be subsidized by other neighborhoods.  Others will simply have to be less comprehensive.  For instance, fire department and emergency response times are much longer in low-density areas, simply because people are farther away from stations.

Per Capita Expenditures

(vary primarily by number of peopled that must be served)


Per Area Expenditures

(vary primarily by amount of area that must be serviced)

  • Schools
  • Judicial systems
  • Health
  • Community Development
 
  • Fire
  • Sewage
  • Other utilities
  • Stormwater Management
  • Sidewalks
  • Streetlights
  • Roads
  • Public Transportation
  • School buses

Continue reading

Virginia’s Changing Economy

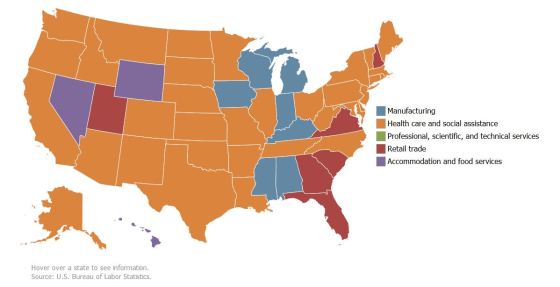
Recently, the Bureau of Labor Statistics published a map of industry sectors with the highest employment by state over the past couple of decades.  The map shows clearly America’s shift from manufacturing to retail to healthcare.  Retail trade has led in Virginia since 1996, even as the rest of the states have been taken over by healthcare.

BLS2013 Continue reading

Low-wage workers are more diverse than you think

The perfect cup of coffeeIn his 2014 State of the Union address, President Obama called on Congress to “give American a raise” by increasing the federal minimum wage. For the second year in a row he argued “that in the wealthiest nation on earth, no one who works full time should have to live in poverty”. Even with the presidential priority of raising the Federal minimum wage, the 2014 House bill was voted down. In spite of this, many states and cities have opted to raise the basic hourly wage independent of the federal government.

Raising the minimum wage will impact employers and employees alike, and through them the larger society. While fewer than three percent of US workers* earn the minimum wage (or less), 18 percent earn less than $10.10/hour (the amount proposed by the President).  Understanding how an increased minimum wage will affect individuals first requires examining common arguments about low-wage workers.

Continue reading

Virginia is getting older

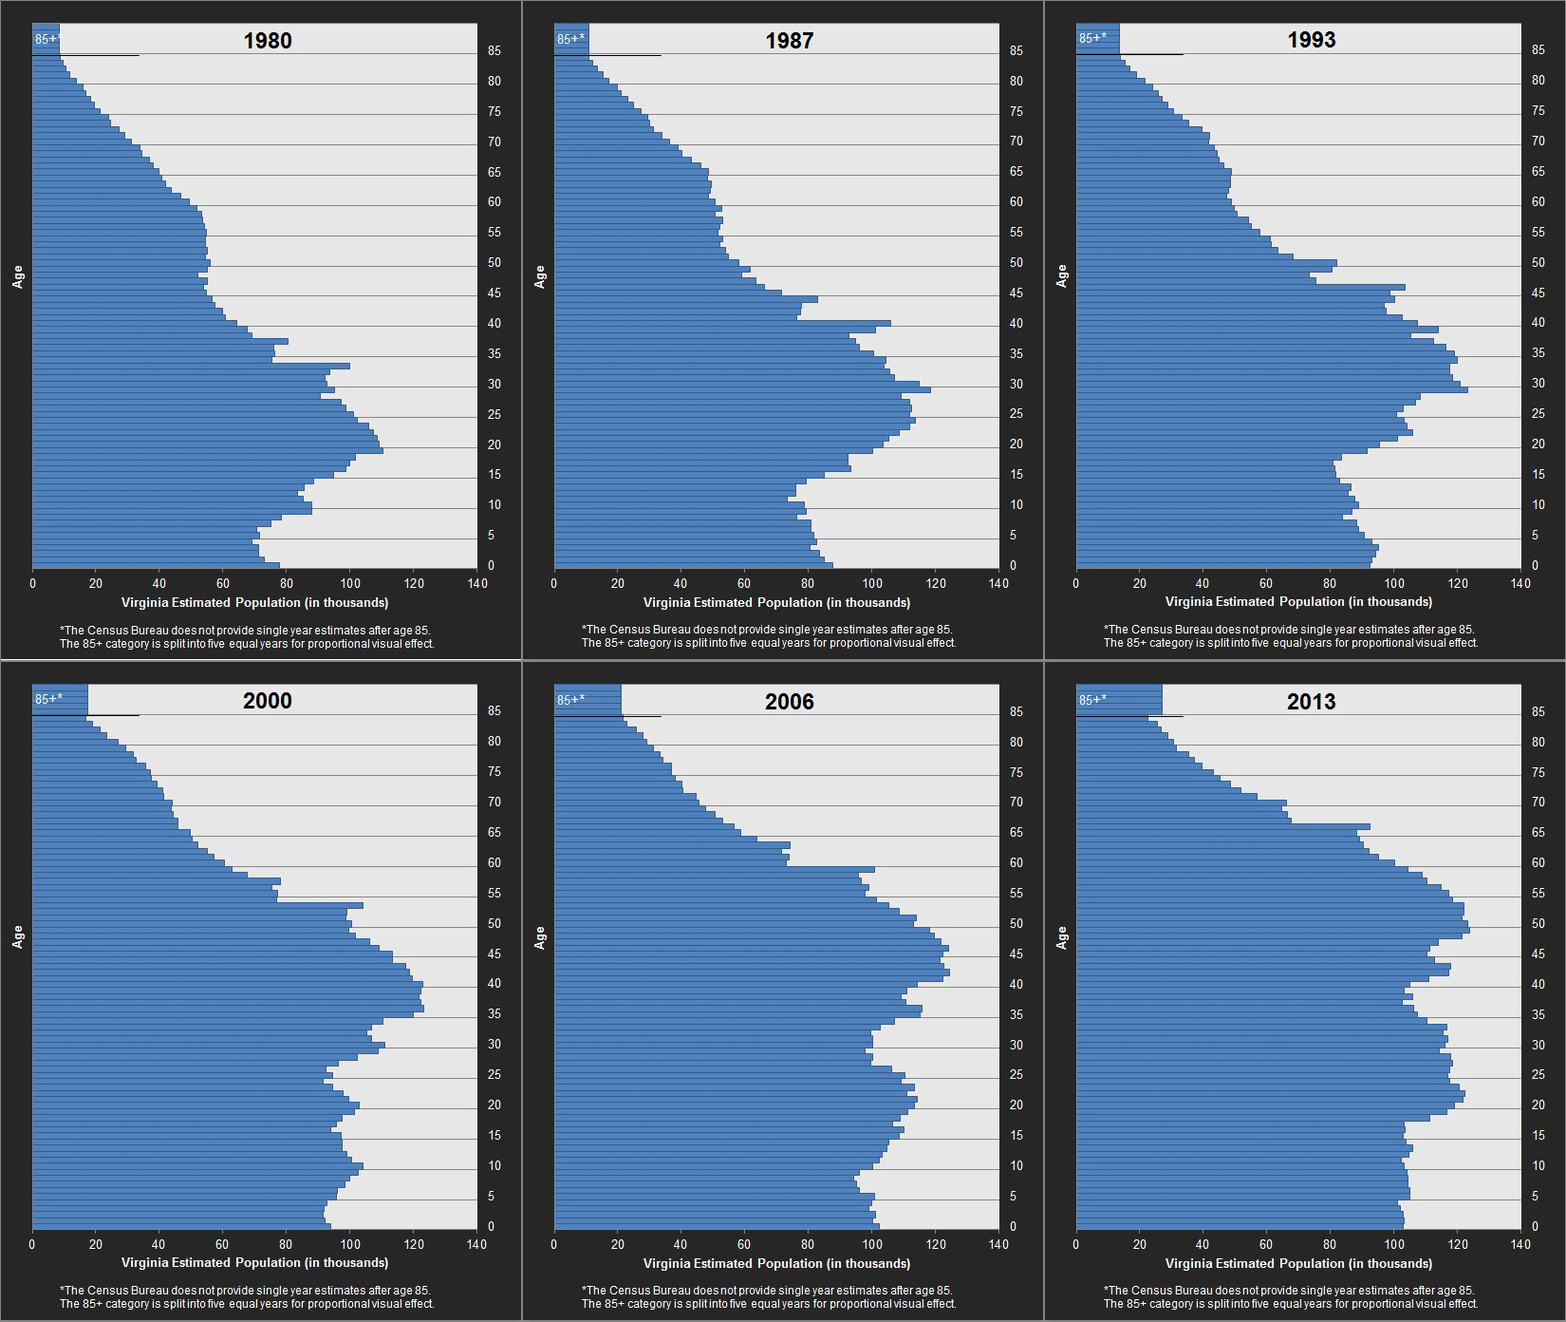
Like many people, I’ve been inclined to explain Virginia’s decades of explosive population growth in terms of migration and the Federal government’s expansion in Northern Virginia.  While that’s certainly part of the equation, “natural increase” has actually driven most of the growth, just as it has across the country.  Natural increase simply means more people are born than die in a year.  Even in Northern Virginia and Hampton Roads, natural increase is the largest generator of population growth.  But “natural increase” does not mean that we are having lots and lots of babies.  In fact, it has much more to do with the fact that we had a lot of babies a while back and since then people started living a lot longer.

You hear, on this blog and elsewhere, about the “aging population,” but I wanted to show exactly what that means.  Here’s the one gif you need to see to understand population growth in Virginia:

1980

Continue reading