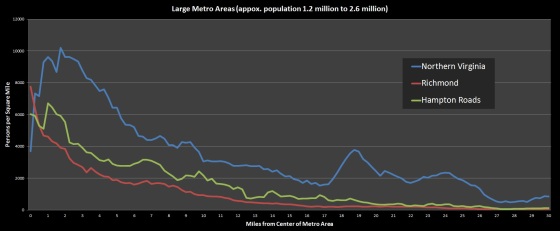
Average Density of Virginia’s Metro Areas

Recently, I’ve been comparing a number of traits of metropolitan areas based on distance from the core.  Here I’m looking at the average densities of each metro area as you travel outwards from the center, calculated using census blocks and 2010 short-form census data.  I’ve graphed them in groups of three.  Cities with a strong core will have high densities on the left (near the center) that fall off as you travel outwards.  Cities whose densities fall off quickly on the right have clearer edges, while those that taper off slowly are more spread out.  Click on the graphs to view them full screen.

First are the three major metro areas.  Note that the Northern VA graph includes only Virginia census blocks, not the rest of the DC area.  Northern VA has the largest population by far, with fairly high densities even several miles into the suburbs.  Richmond has the smoothest curve.  I used downtown Norfolk as the core for Hampton Roads, but the area’s polycentricity is obvious.

Large Continue reading

Predicting Sprawl

The Weldon Cooper Center, under contract with the Virginia Employment Commission (VEC), developed and released in 2012 the most recent round of official state population projections for Virginia.  These projections, consistent with others commissioned or developed in the past by the VEC, focus primarily on trends in the number of people currently living in Virginia and expected to live in Virginia ten, twenty, and thirty years from now

It’s one thing to think about growth in terms of numbers of people, but another to think about it in spatial terms – as the growth of physical urbanized areas.  For a while now, I’ve been working on a GIS model that will do that.  I’ve posted it before on my own blog, but since then I’ve cleaned it up and made it follow our regional population projections more rigidly.

Today

Here’s a land cover raster (an image showing what primarily covers each 15Mx15M square of land) of Virginia in 2006.  All developed land is in red.  It’s a great image of the shape of our metro areas.

Current

25 Years From Now

Here is a map of what that might look like in 2040 if: Continue reading

Virginia’s 2013 Metro Areas

Metropolitan Statistical Areas (MSAs) or Metro Areas are perhaps the most common way to define an urban region. Because many urban areas cross into multiple localities, such as in Hampton Roads, MSAs are frequently used in the public and private sector to understand an urban area and its suburbs. Despite the widespread usage of MSAs, it is actually very difficult to find an up-to-date map of Virginia’s MSAs, which is why I created this updated map following the 2013 definitions from the Office of Management and Budget.

Virginia 2013 Statistical Areas

MSA Map 2

(Click on the map for a larger version)

Continue reading