Virginia’s immigrants: Where do they come from and where are they now?

The foreign-born, or immigrants, comprise more than 10% of the Commonwealth’s population.  Most of them are between 25 and 44 years of age. This young cohort is highly active both in terms of production (working) and reproduction (having children). The adult foreign-born, for example, make up 15% of the Commonwealth’s workforce; and a fifth of all native-born children below the age of 18 have at least one foreign-born parent. More details are available here.

Contributions of the foreign-born population to multicultural diversity can be explored in several ways; where they come from and where they stay plays a key role in this story. A hundred years ago, most foreign-born people were from European nations; today almost 80% of immigrants to Virginia originate form Asia or Latin America. The top five countries of birth for the contemporary foreign-born population are El Salvador, India, Mexico, Philippines and Korea.  What is also of significance is where these immigrants choose to live within Virginia.

Slide2The distribution of foreign-born people among Virginia’s 11 metropolitan areas (MSAs) can be seen in the map above. Close to 70% of immigrants can be found in Northern Virginia alone, with Hampton Roads and Richmond hosting about 10% each. Among the smaller MSAs, Charlottesville leads the pack with nearly 20,000 foreign-born individuals, many of whom are students, faculty or staff at the University of Virginia.  The non-metro, mostly rural areas are home to less than 3 percent of the foreign-born.

The map below shows the percentage of each MSA population that is foreign-born. Again, Northern Virginia leads the way, with nearly a quarter of its population being immigrants. Harrisonburg and Charlottesville MSAs have a high proportion (nearly 9%) of foreign-born people, closely followed by Winchester and Richmond (7%), and Virginia Beach and Blacksburg (6%).

Slide3

What are the young people up to these days?

Much has been made of the living preferences and economic situation of millenials.  In the current economy, most localities can expect to lose almost all of their brightest young people to college towns.  Whether these localities are able to lure these college graduates back is another story, and an important one since (many argue) it’s during the free-and-easy years after college that most young people will start businesses, launch careers, and develop regional networks and allegiances.

In this post, I’ll take a closer look at the people who were in their 20’s during the 2010 census.  That’s people born between 1980 and 1990.  As one might expect, those 80’s babies were reasonably well-distributed when the prior census was taken in 2000.  At this point, the millennials were anywhere from 10 to 19 years old.  There was an uptick in college towns (18 and 19 year-olds), but it wasn’t huge.  In fact, that uptick helps to balance out the number of millenials who were undergraduates during the 2010 census (20 and 21 year-olds).

Ten years later, some of those kids are still in college or graduate school, some are young professionals, some are in the military, some are in prison, and some have young families with several kids.

Image

Continue reading

Virginia Population Estimates: Growing More Slowly

Every year, the Cooper Center produces the official population estimates for the commonwealth of Virginia. The estimates are based on changes since the 2010 census in housing stock, school enrollment, births, deaths, and drivers’ licenses. The estimates are used by state and local government agencies in revenue sharing, funding allocations, planning and budgeting.

Slower Growth Overall
This year’s estimates show that Virginia’s population grew by less than 1 percent between July 2012 and July 2013 to 8,260,405, the slowest growth since before the recession began. Between 2010 and 2013, Virginia’s population has grown 3.2 percent. While the number of births has fallen in recent years, the recent decline in Virginia’s growth rate was caused largely by fewer people moving into the state.

                                    Change in population 2010 – 2013
2013 Change


Continue reading

A quick glance at School Enrollment Projections

Being primarily an Economist, and the newest member of the group, I still have a lot to learn about the demographic changes affecting Virginia and the US. So attending the Applied Demography Conference 2014 was a very educative experience for me. One of the subjects I found particularly interesting was school level projections, so here are some thoughts on the subject.

School enrollment projections are crucial for staffing, budgeting and classroom allocations as school districts rely on these numbers to anticipate future needs and plan accordingly. It is reasonable to assume that number of students in a particular grade will depend upon the class-size of this cohort when they were in the immediately preceding grade. Consider a batch of students moving from 9th to 10th grade between 2012 and 2013.

Image

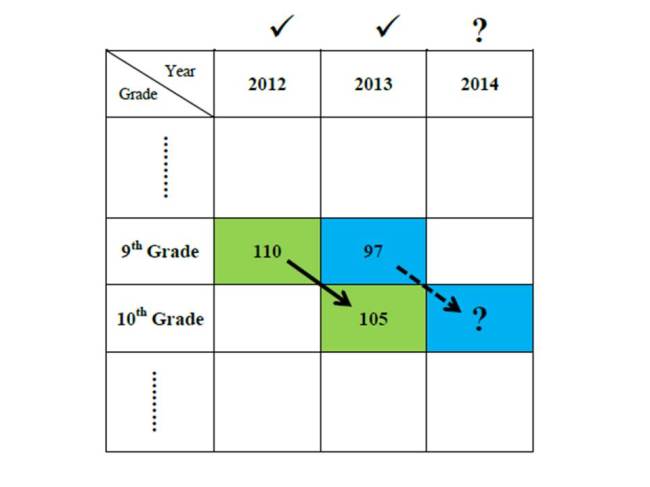
If everything remained constant, all 110 9th graders from 2012 should progress to 10th grade in 2013 and so forth. However the numbers are not always the same which could be due to several reasons. As we go from 9th to 10th grade, 5 more students could have joined the cohort in 2013 so the class-size would grow to 115 as some new children may have moved into the school district from elsewhere. Alternatively in 2013 when we follow these 9th graders into 10th grade there may be 5 fewer students, making the class size 105 for the next year. Some of these children could have remained in the previous grade to repeat a year, they may have left to join a different school or may have dropped out of school altogether causing the class-size to shrink. Hence all students from a grade may not automatically advance to the next higher grade and we need a method for estimating future class-sizes. Grade Progression Ratio (GPR) is the standard go-to for forecasting school enrollment. To see how this works, suppose you are a school administrator who needs to know how many students to expect in the 10th grade in 2014.

From the example above we find that GPR9th-10th  = 10th grade Enrollment in 2013/9th grade Enrollment in 2012 = 105/110 = 0.95, which implies that we expect 95% of students in 9th grade to move on to 10th grade. To calculate the current enrollment for grade 10 in 2014, we can apply the progression rate from last year: 10th grade Enrollment in 2014 = 0.95 * 97 = 92.59. Therefore approximately 93 students are projected for the upcoming year. This is a simplified illustration of how we may predict the expected number of students in different grades in the future.  In practice, we use data from multiple years to build ratios in order to minimize randomness and several other elements must be incorporated into the calculations to get greater reliability.

Here are some other updates and advances about enrollment projections:

  • One way to calculate future student enrollment in rapidly expanding areas is to track new residential developments (historical trends, current construction, home sales etc. are indicators of single-family and multi-family presence in the school districts) for creating different area-specific yield factors.
  • For each new house that is constructed, there are several pre-existing homes that exchange hands; so neighborhoods could evolve even though number of housing units remains steady. New families come into ownership of these resold properties changing the population composition which in turn may change the demand for schooling.
  • Migration alters the prevailing age structure and family type of a locality which will determine schooling needs. Number of school age children in a household fluctuates over time and migrating households could contain elderly individuals with adult offspring or they may be young families planning for or already with children. For example, a 3rd grader moves with the whole household while a college student moves alone and movement of empty-nesters will not add new students to an area.
  • Geo-spatial analysis has become an indispensable tool for understanding modern demography. Families move and household composition changes, therefore the geographic distribution is useful for identifying trends in student yield with variation in housing tenure. Plotting child-densities on a map helps to visualize concentration of students in a school district and could improve the accuracy of projections.
  • Public school enrollment rates may be affected by presence of private schools among others; the odds of attending a private school significantly depend upon household income, race and neighborhood of residence. The economic climate also plays a significant role as in times of prosperity more families can afford to send their children to private institutions. Public schools will receive more funding during economic booms as opposed to times of recession when the financial downturn percolates into both household and administrative schooling decisions.

All trend projections and estimates are speculative in nature which means that there is a constant need for dynamically updating the statistics. Here at the Weldon Cooper Center, every year we conduct school enrollment projections under contract with individual school divisions. We apply Grade Progression Rates for general analyses and implicitly take account of net effect from migration, dropout, deaths, retention, and school transfers. For more customized analyses, we include further nuances into the methodological design such as housing development, family structure, differential fertility rates by race and ethnicity etc. to incorporate location specific characteristics. For more details please visit our School Enrollment Projections page.
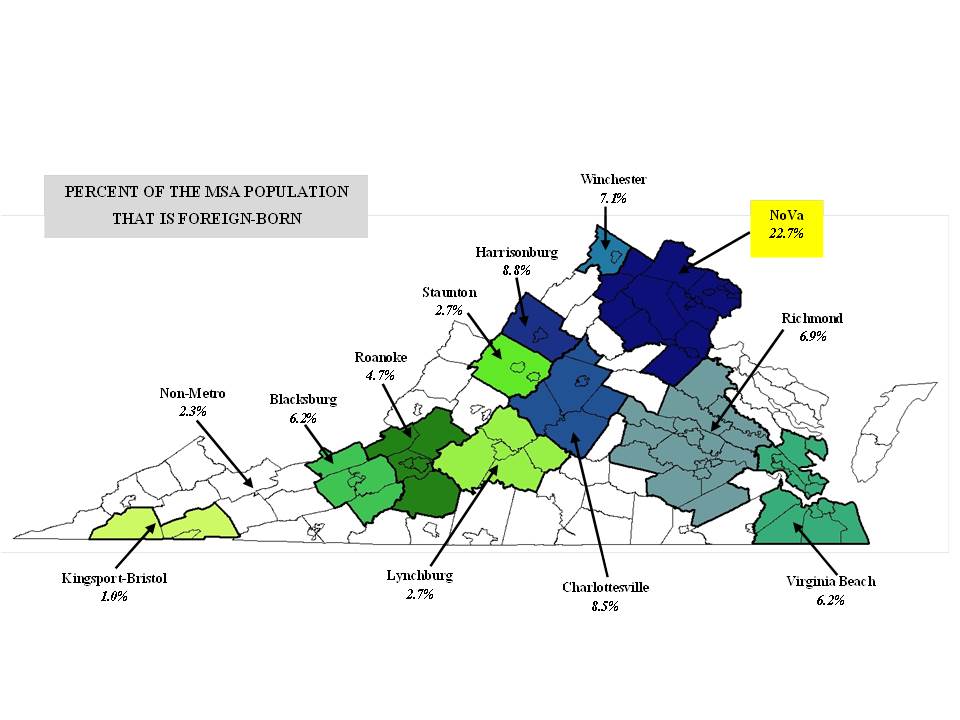
A map that shows what’s wrong with Washington

2008 Election Dot Map, NortheastThe recent government shutdown and flirtation with default has seriously deteriorated public trust in Congress, and in Washington more generally.  Disgust with Washington is often followed by bewilderment. How did things get this way?

While there is no single answer to this question, if I had to choose one, it would be current redistricting practices. There is a strong case to be made that political polarization (and associated intransigence and brinkmanship) are rooted in gerrymandered congressional districts.

Gerrymandering, the art and science of lawmakers choosing their own voters rather than the other way around, has ensured that most representatives in the U.S. House are safe from general election challenges.  Without those challenges, positions taken by elected officials are not exposed to debate and to the typically moderating effect of contested elections.  In contrast, in gerrymandered districts where it is clear that one party or the other has a more or less certain general election victory in hand, candidates from the opposing party opt out of running (or have little real chance of winning if they do). As a result, the only threats to these lawmakers come in contentious primary contests from the hard left and hard right.  Being “primaried” is now a common term among political strategists, and is often used to describe well-financed tea party challengers who unseat moderate Republicans. As moderation, from either side, is lost in primary challenges, the result is more rigidly ideological victors and the deadlock we see with increasing frequency in Congress.

This connection between redistricting, polarization, and legislative dysfunction is complicated, and as soon as political scientists start talking about the nuances of this subject the message sometimes gets lost.  So I decided to create a visual to help illuminate what is really going on…

Link to the full interactive Congressional Dot Map.

Continue reading

Need Census data during the shutdown?

One of the little noticed effects of the federal government shutdown is that many federal statistics and reports that we rely on are currently on hold.  For example, the all-too-important September jobs report never came, and if the shutdown continues, we all may miss out on measuring the unemployment rate for October.  Even updates to the consumer price index, which adjusts government benefits for inflation, may be delayed.

If you want to look up past U.S. Census Bureau data you will encounter problems as well. The popular American Factfinder and Census Bureau websites are now unavailable.  So, here are a few tips for those who us who are in need of data right now:

  • Free of charge, The University of Minnesota’s National Historical Geographic Information System provides aggregate statistics from the decennial censuses and the American Community Survey (ACS).  I have used data from these folks on many of my projects and can vouch for their simple and intuitive interface.
  • For the next few weeks, the Social Explorer website is providing free access to its data.  Social Explorer is a great website for Census data and also offers neat visualization capabilities.  But I wouldn’t get too cozy with using their services; they usually charge a fee, and it’s hard to say how long their generosity will last.
  • If you have some data analysis skills, the Integrated Public Use Microdata Series (IPUMS) project is still open.  The site is another Minnesota creation and is a favorite of mine.  They provide access not only to past censuses and the ACS, but data from the Current Population Survey (CPS) as well.  If you don’t have SAS, SPSS, or STATA software you can always use their online analysis tools. The interface isn’t all that great and requires some expertise to navigate, but it does allow for very detailed analyses.
  • If you need only local or state-level data, many states have decent data centers you can check out.  For all of you Virginians out there, you can always visit the Weldon Cooper Center website and see the work we do.  We provide county population data, projections, and an interactive map that has local data from the ACS and past censuses.

Dustin Cable is a Senior Research Associate at the University of Virginia’s Weldon Cooper Center for Public Service where he conducts research on topics that lie at the intersection of demographics, politics, and public policy.

Little Green Boxes

One of the most frequent observations from people who have recently viewed our new Racial Dot Map is the presence of these “little green boxes” scattered throughout the country.  The map displays a single dot for every person counted during the 2010 Census and every dot on the map is color-coded by race and ethnicity:  non-Hispanic whites = blue; African-Americans = green; Asians = red; Hispanics = orange; and all other races = brown.  These peculiar green boxes on the map can be found everywhere and seem oddly out of place:

In a suburb of Philadelphia:

Philly

Continue reading

The New Racial Dot Map

As our regular readers already know, I’ve been playing around with a lot of dot density maps lately.  Today, however, we are releasing something new I think you might enjoy even more.

We decided to rehash Brandon Martin-Anderson’s idea of plotting one dot for every person in the United States, but with an added twist.  The new Racial Dot Map is an American snapshot; it provides an accessible visualization of geographic distribution, population density, and racial diversity of the American people in every neighborhood in the entire country. The map displays 308,745,538 dots, one for each person residing in the United States at the location they were counted during the 2010 Census. Each dot is color-coded by the individual’s race and ethnicity.

RacialDotMap

The map is fully interactive so you can zoom into any neighborhood you wish.  You can read more about the map and how we created it here.

Enjoy!

Dustin Cable is a Senior Research Associate at the University of Virginia’s Weldon Cooper Center for Public Service where he conducts research on topics that lie at the intersection of demographics, politics, and public policy.